
Sponsored

Science is now cancelled? [USERS NOW BANNED FOR POLITICS]

Gregs24

Well-Known Member
Joined
Aug 31, 2018
Threads
23
Messages
4,782
Reaction score
3,062
Location
Wiltshire UK & Charente FR
First Name
Greg
Vehicle(s)
Mustang V8 GT, Ford Kuga PHEV
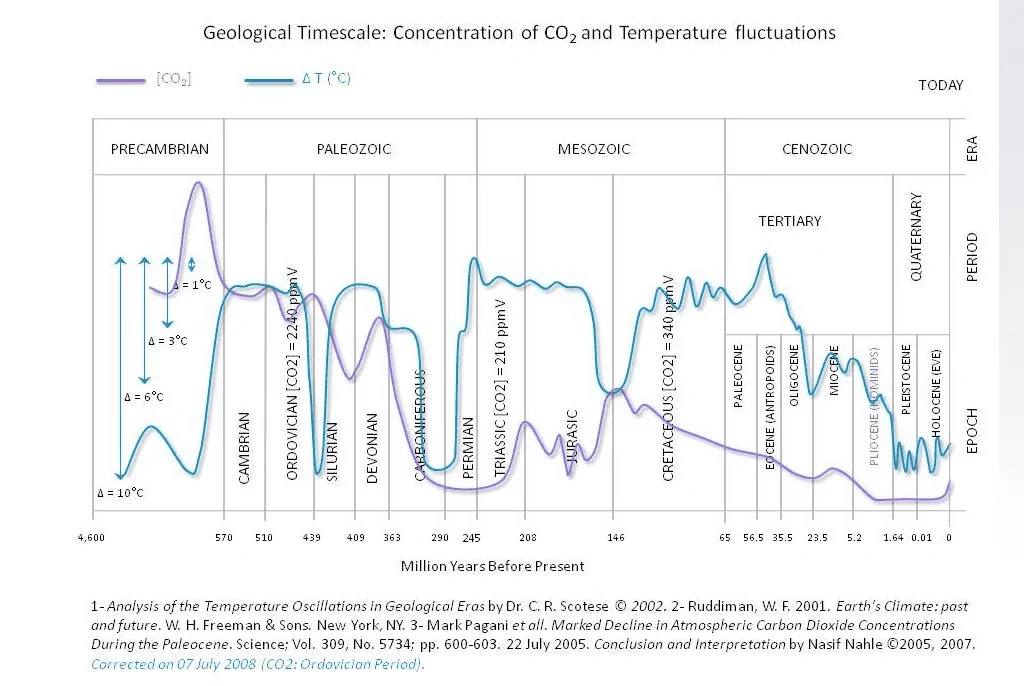
Looking at the chart I posted, taken from the OP, simple math shows over the last 500 million years the earth has been without ice caps longer than with.

Tells me without ice caps is more normal than with.
Great - lose the ice caps and see what is left of the world as we know it. I hope you live on a hill :giggle:
Sponsored


Gregs24

Well-Known Member
Joined
Aug 31, 2018
Threads
23
Messages
4,782
Reaction score
3,062
Location
Wiltshire UK & Charente FR
First Name
Greg
Vehicle(s)
Mustang V8 GT, Ford Kuga PHEV
If you carry it out to the other end, something caused the earth to rapidly cool.

Looks like NORMAL cycles to me.
It has been explained to you time and time again that it is not 'normal cycles' and is anthropomorphic in the last 100 or so years. You can keep ignoring the facts but it will not change what is happening.
 

Gregs24

Well-Known Member
Joined
Aug 31, 2018
Threads
23
Messages
4,782
Reaction score
3,062
Location
Wiltshire UK & Charente FR
First Name
Greg
Vehicle(s)
Mustang V8 GT, Ford Kuga PHEV
If you carry it out to the other end, something caused the earth to rapidly cool.

Looks like NORMAL cycles to me.
Here you go - it was from another thread so to make life easy for you I have copied and pasted it for you. remember I posted this including the graph you have just posted so nothing to hide here.

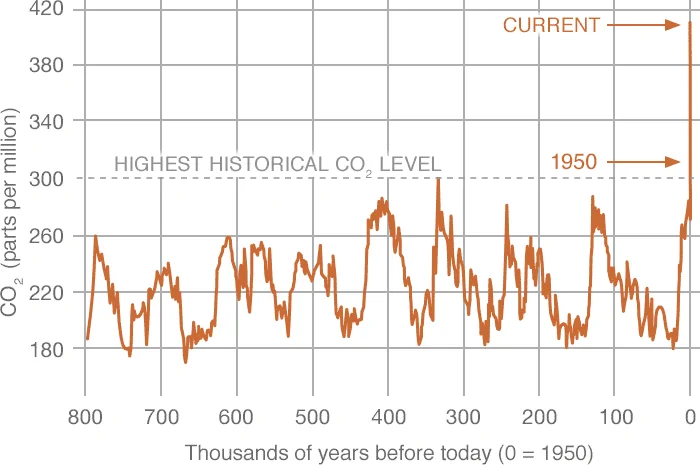
This graph below, or similar, is often trotted out to 'back up' the argument that the Earth goes through cycles of warming and cooling over the years, so it is all natural and nothing to do with man, CO2 and greenhouse gasses - and it does appear that way as per the graph, BUT you need to look at the last pixel on the right on that timescale!

1621413139147-png.png


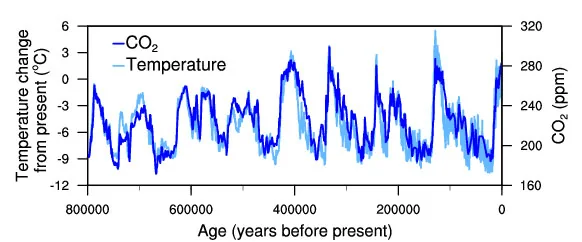
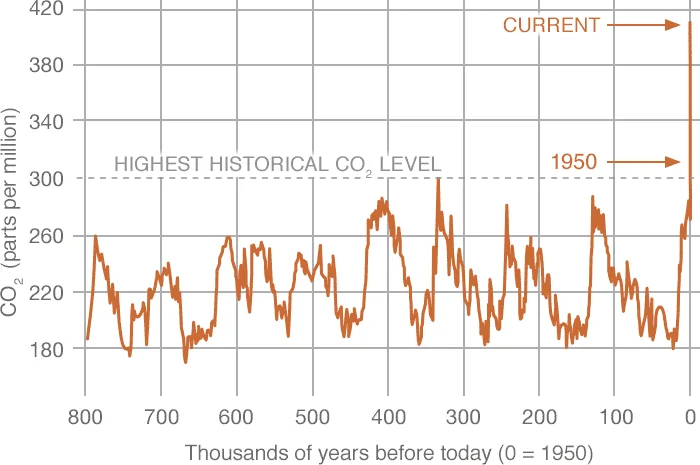
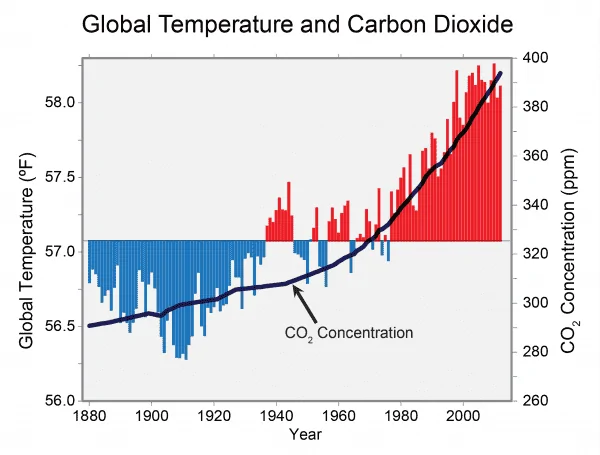
Firstly, CO2 is not the only driver of global temperature and there were some very strong drivers of global temperature millions of years ago that are not changing significantly at present. Secondly almost that entire graph has no human derived input until the very last little squiggle - as in it is driven by natural factors. However the link between CO2 and temperature during more recent years is dramatic and clear. The first graph below uses Ice core samples to correlate CO2 and temperature, the latter is just CO2 but shows the recent dramatic uptick. The link is VERY clear between CO2 and climate change. Then look at the huge uptick in the last 50 years and have a guess what is happening!

1621412968106-png.png


1621412977575-png.png


1621413653849-png.png
 

K4fxd

Well-Known Member
Joined
Apr 2, 2020
Threads
122
Messages
13,482
Reaction score
12,301
Location
NKY
First Name
Dan
Vehicle(s)
2017 gt, 2002 FXDWG, 2008 C6,
Each one of those graphs show the earth goes through cycles. We have nothing to do with it.
 

Sponsored

Sivi70980

Well-Known Member
Joined
Feb 28, 2019
Threads
17
Messages
2,362
Reaction score
4,006
Location
Lacey, Washington
First Name
Mark
Vehicle(s)
2019 Ruby Red GT PP1 M6
Leave it to the human ego to think they matter at all in the grand scheme of things. We're just a bigger less awesome ant.
 

sk47

Well-Known Member
Joined
Nov 12, 2020
Threads
32
Messages
6,858
Reaction score
3,191
Location
North Eastern TN
First Name
Jeff
Vehicle(s)
Chevy Silverado & Nissan Sentra SE
Looks to me like you don’t know how to use a chart properly.
If you could explain how you could possibly get the kind of resolution required to properly make your point, from a graph where each mm represents 5 million years, you’re much better than the rest of us.
Alternatively, you could maybe listen to the people who produced the fucken graph in the first place, instead of pretending you have some magical insight that they somehow missed.

If you aren’t clever enough to work out that the chart lacks the required resolution, it’s unlikely that you’re bright enough to argue against the science behind it.
[/QUOTE]
Hello; can I take this as being as close to an answer from you I will ever get about significant numbers. That being how we can measure in scale down to fractions of a degree daily currently if desired compared to the scale of ice cores and/or other ancient estimate climate data. To summarize my question- can there be gaps in the data big enough to hide a brief warming trend such as what we see currently?
 

Gregs24

Well-Known Member
Joined
Aug 31, 2018
Threads
23
Messages
4,782
Reaction score
3,062
Location
Wiltshire UK & Charente FR
First Name
Greg
Vehicle(s)
Mustang V8 GT, Ford Kuga PHEV
Hello; can I take this as being as close to an answer from you I will ever get about significant numbers. That being how we can measure in scale down to fractions of a degree daily currently if desired compared to the scale of ice cores and/or other ancient estimate climate data. To summarize my question- can there be gaps in the data big enough to hide a brief warming trend such as what we see currently?
The ice cores are analysed on an annual basis within the core - as in the smallest period of time for analysis is one year so there can't be 'hidden' warmings that are missed because of the time periods analysed. It is actually quite interesting stuff.

Ice core basics (antarcticglaciers.org)

Paleoclimatology: The Ice Core Record (nasa.gov)
 

Sponsored

K4fxd

Well-Known Member
Joined
Apr 2, 2020
Threads
122
Messages
13,482
Reaction score
12,301
Location
NKY
First Name
Dan
Vehicle(s)
2017 gt, 2002 FXDWG, 2008 C6,
What is causing the CO2 spike on this graph then ?
If that graph is correct, what about the other twin posting information that says Co2 has nothing to do with warming?

Sometimes Co2 precedes warming and sometimes Co2 lags warming. I think Burke posted that info.

Let's put this together, More Co2 = healthier plants, healthier plants make more O2. More O2 = healthier animals, including humans.

Warmer climate = longer growing seasons further North. The soil in the North is better than the soil in the South. = better crops = more food.

So what, the coast moves a few miles inland. Looks like a net win to me.

Now if we could cause it we could steer a hurricane to hit NO.......
 

Gregs24

Well-Known Member
Joined
Aug 31, 2018
Threads
23
Messages
4,782
Reaction score
3,062
Location
Wiltshire UK & Charente FR
First Name
Greg
Vehicle(s)
Mustang V8 GT, Ford Kuga PHEV
If that graph is correct, what about the other twin posting information that says Co2 has nothing to do with warming?

Sometimes Co2 precedes warming and sometimes Co2 lags warming. I think Burke posted that info.

Let's put this together, More Co2 = healthier plants, healthier plants make more O2. More O2 = healthier animals, including humans.

Warmer climate = longer growing seasons further North. The soil in the North is better than the soil in the South. = better crops = more food.

So what, the coast moves a few miles inland. Looks like a net win to me.

Now if we could cause it we could steer a hurricane to hit NO.......
Well the graph is correct to start with. There is some truth that the fear of all climatologists at present is that as global temperatures rise the warmer sea will release more CO2 and that in turn will cause further warming, a positive feedback catastrophe. Of course CO2 has an effect on warming - but there have been far bigger drivers over huge time scales in the history of the planet which are not changing currently by any significant degree. Things such as the sun's output, massive volcanic activity millions of years ago, changes in land mass / location and the sort of vegetation growing.

Your other 'suggestions' are far too simplistic. Increased global temperature puts a load of extra energy in the atmosphere which changes global weather patterns. It doesn't just warm up the poles and frazzle the equator. There is a major concern that polar ice cap melt dumping loads of fresh water in the oceans will 'switch off' the gulfstream which will have catastrophic effects on global weather patterns.

Incidentally O2 is not in short supply and increasing it will make no difference compared to the massive effect of raised CO2
 

K4fxd

Well-Known Member
Joined
Apr 2, 2020
Threads
122
Messages
13,482
Reaction score
12,301
Location
NKY
First Name
Dan
Vehicle(s)
2017 gt, 2002 FXDWG, 2008 C6,
What about the earths orbit? What about the tilt? You know the earth wobbles like a slowing top, right?

So what if the orbit is on avg closer to the sun? Where in the wobble are we? Is the earth's magnetic field weaker, allowing more energy in?

Just a few questions of many.
 

sk47

Well-Known Member
Joined
Nov 12, 2020
Threads
32
Messages
6,858
Reaction score
3,191
Location
North Eastern TN
First Name
Jeff
Vehicle(s)
Chevy Silverado & Nissan Sentra SE
The ice cores are analysed on an annual basis within the core - as in the smallest period of time for analysis is one year so there can't be 'hidden' warmings that are missed because of the time periods analysed. It is actually quite interesting stuff.

Ice core basics (antarcticglaciers.org)

Paleoclimatology: The Ice Core Record (nasa.gov)
Hello; Read the first link ICE CORE BASICS. Found the comments after the article to be of much interest. I have not digested the information in the article just yet so will not comment just now. Lots of angles to consider. As in most science the issue is not as clear cut once you get outside a narrow window of one variable and a control. Those who want to get a range of opinion perhaps ought to read the comments that follow the article. some interesting questions and comments.
 

K4fxd

Well-Known Member
Joined
Apr 2, 2020
Threads
122
Messages
13,482
Reaction score
12,301
Location
NKY
First Name
Dan
Vehicle(s)
2017 gt, 2002 FXDWG, 2008 C6,
Incidentally O2 is not in short supply and increasing it will make no difference compared to the massive effect of raised CO2
Obviously you have never grown vegetables in a green house. Adding Co2 greatly increases quality and size.
Sponsored


Top